Profiling Results window
The Profiling Results window is available from the View menu.

The Profile Results window displays the timing statistics of your program lines or statements. It is a graphical representation which you can use to determine which lines of your program consume the most CPU time, and thus may benefit from optimisation or re-writing.
Before you can use this window, you must enable Profiling from the Run menu.
How to enable Profiling
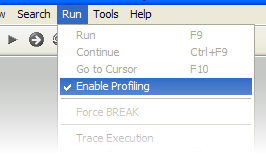
You can enable profiling by checking the Enable Profiling option from the Run menu:

If your program is already running, then profiling will not commence until you next run it.
The code profiler then gathers information about each line that executes from your program, and stores a cumulative "counter" of the number of T-States (machine cycles) that BASIC spends in that line. When your program finishes (or you BREAK out of it) then you can call up the Profile Results Window to view that information.
Interpreting the profiling results
The following picture shows some typical results from a profiling session:

As you can see, the list is divided into three areas:
- Usage Graph
Situated to the left of each list entry, is a graphical representation of the time taken by each statement. This is useful to quickly determine which line took the most time to execute. There are two modes of operation, which depend on the state of the Relative Usage checkbox.
By default, each bar is a proportion of the time taken by each statement in relation to the time that the program spent actually running.
- Line
This column shows the line and statement number (using the standard Sinclair notification of Line : Statement).
- Contents
This final column shows the actual BASIC code present in that line. You can use this to maybe see why a statement took so long - maybe a PAUSE or INPUT command which will take longer due to waiting for user input or a timed delay.
You may notice that the first list item in the profile list will always be "RUN" or "GO TO". This is because the direct command used to launch the program is included in the profile.
Any lines that have been executed will be listed along with their "graph" statistics - any lines that did not execute will be shown in grey.
Getting timings for single lines, or groups of lines
By selecting a line in the list, you can view the statistics for that line at the top of the window:

You can multi-select many lines using the Shift and Ctrl keys when clicking a list item. When you have selected the lines you are interested in, you can click the Show Selected button. When this mode is active, you will only see the lines you selected in the list, and the "graphs" will now show you results relative to the new list. This is useful for examining a single subroutine, or comparing two sets of lines.
The first line of information is the time spent for the whole program (or if you have obtained information for a group of lines, it will be the time for that group). This will be in TStates (the smallest unit of time), Frames (50ths of a second) and Seconds (for lines or groups that have taken a long time to do their job).
You can click the Show All button (which was the Show Selected button) to return to the main list.
Finally, there is the Relative Usage Statistics checkbox at the bottom left of the